Home Screen Home Screen
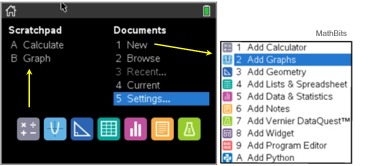 |
From the HOME screen, there are two ways to start working with a graph:
1. From Scratchpad, choose B. Graph.
2. From Documents, choose 1 NEW,
then
2 Add Graph. |
|
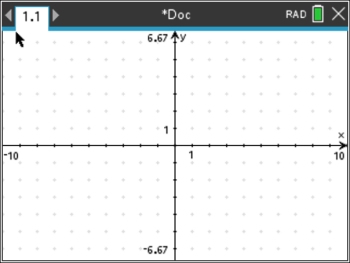
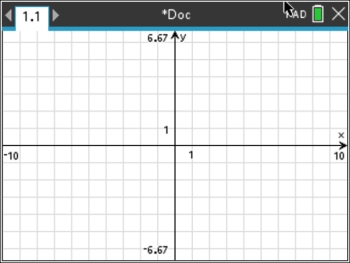
 The default viewing window: The default viewing window:
The Standard Window on the TI-Nspire CX II (shown at the right) is 20 units wide x 13.29 units high with a screen size of 320 by 240 pixels.
This means that graphs will not be distorted because one axis displays a larger scale than the other axis. The tick marks, of one unit, are of equal length on both axes. |
|
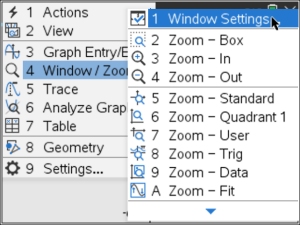
Window Settings:
Set your own window:
Press  -
#4 Window/Zoom - -
#4 Window/Zoom -
#1 Window Setting
|
|
This will allow you to control the window to any dimensions you wish.
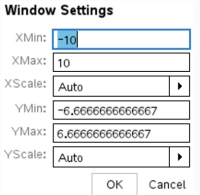
When you create your own window, you may lose the 1:1 aspect ratio of the window.
|
Other ways to adjust the window:
(some of these options may rescale the axis and may not maintain a 1 to 1 aspect ratio)
1. You can change the window settings ON the window itself. Just double click on the value labeled at the ends of each axis and alter it to your new desired value.
2. Move the entire screen: place and hold the pointer  on a blank section of the screen. A "grab" hand on a blank section of the screen. A "grab" hand  will appear. Now, slide the screen around, using the Touchpad arrows, until you get your desired window view. Then hit will appear. Now, slide the screen around, using the Touchpad arrows, until you get your desired window view. Then hit  . . |
Zoom:
There are several "zoom" features. For example, look at "Zoom in".
Adjust the window by choosing - #4 Window/Zoom - #3 Zoom In.
Move the magnifying glass to where you wish the new center to be located and press .
Pressing  will remove the magnifying glass. Press - #4 - #5 Standard to return to the standard window. will remove the magnifying glass. Press - #4 - #5 Standard to return to the standard window.
Grids:
There are three choices of grid backgrounds for your graph under:
, 2 View - Grid
1. No Grid - as seen in the graph at the top of this page (blank white space)
2. Dot Grid - see first graph below
3. Lined Grid - see second graph below
  |
|